2023/2024 Data
As members of the Vol community, we strive to develop, sustain, and nurture a welcoming and inclusive environment in which everyone feels valued and has a sense of belonging. A crucial first step in operationalizing those efforts is recognizing that diversity is a source of strength and innovation. Over the past five years, the Division of Access and Engagement (DAE) has partnered with colleges and units to enhance the diversity of our campus so that it reflects the myriad of cultures, viewpoints, and perspectives that exist within the state of Tennessee. While some incremental progress has been made in increasing the presence of diverse populations on campus over the past year, there is still much work to be done.
In accordance with Goal Three of the Strategic Vision, the university will increase its efforts to enhance its diversity by supporting initiatives that focus on recruitment and retention of students, faculty, and staff from historically underrepresented populations. In addition, DAE will utilize data regarding the campus’s climate and culture to identify the needs of campus stakeholders and provide guidance to leadership on how to foster a greater sense of belonging among all Vols. The data below presents an overview of the University of Tennessee’s current demographics. A more detailed report can be accessed here.
The information presented here is a broad overview of UT’s current demographics. View the complete report here.
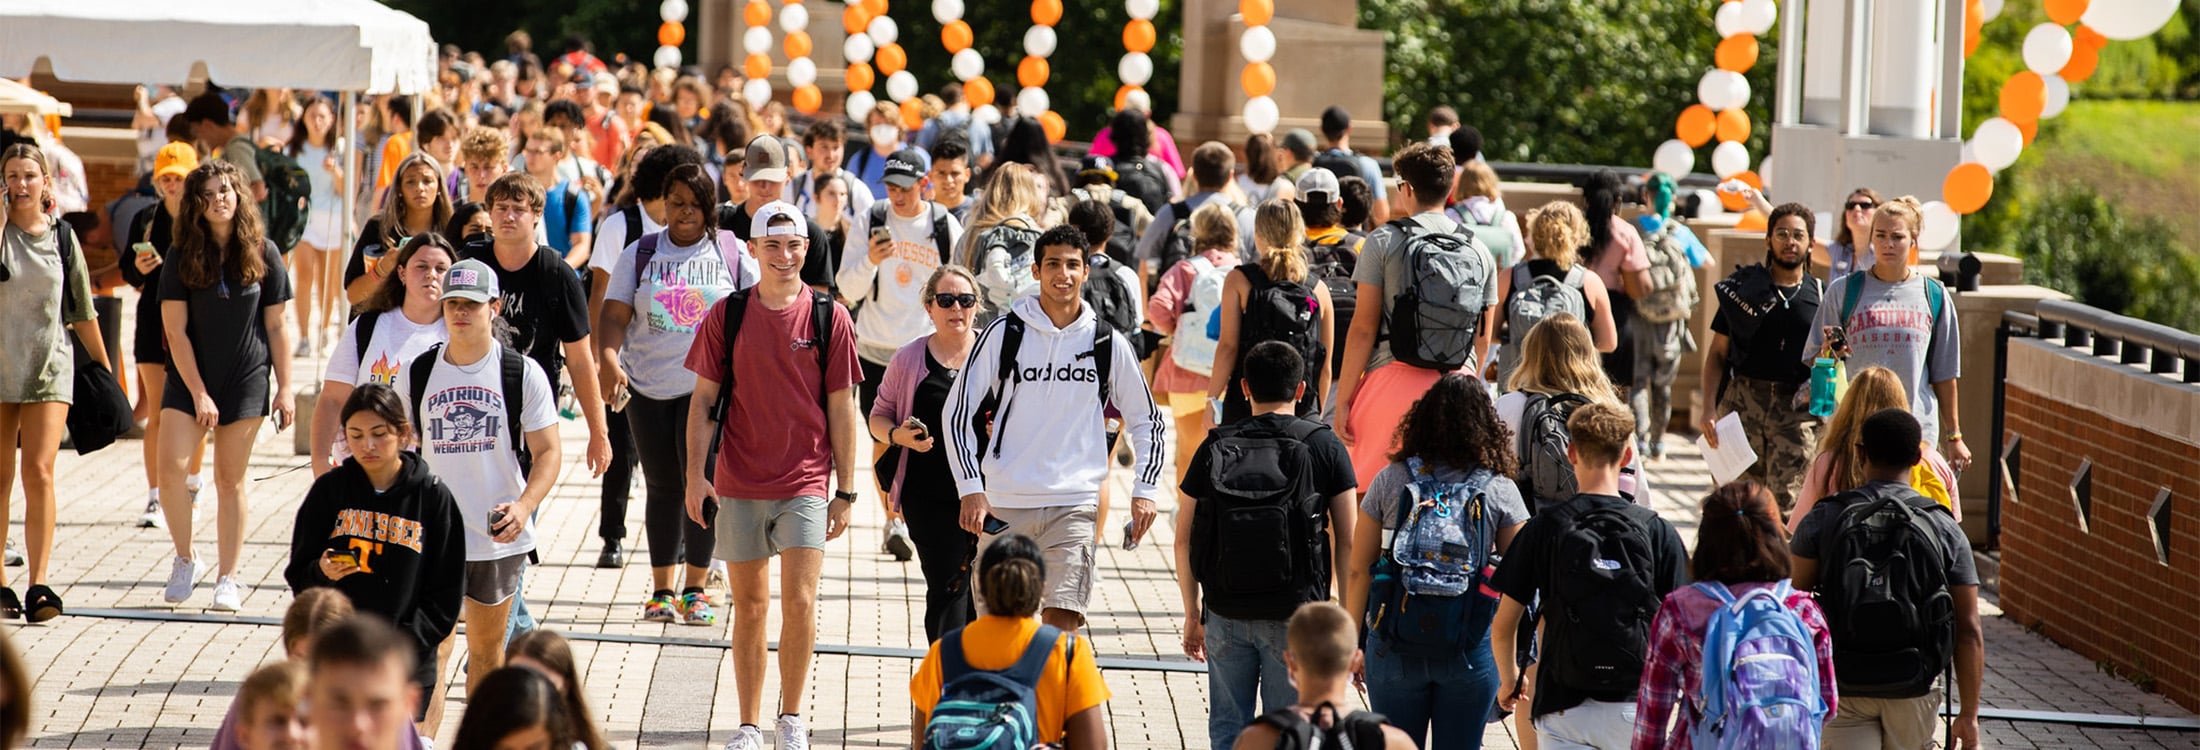
Our Campus at a Glance
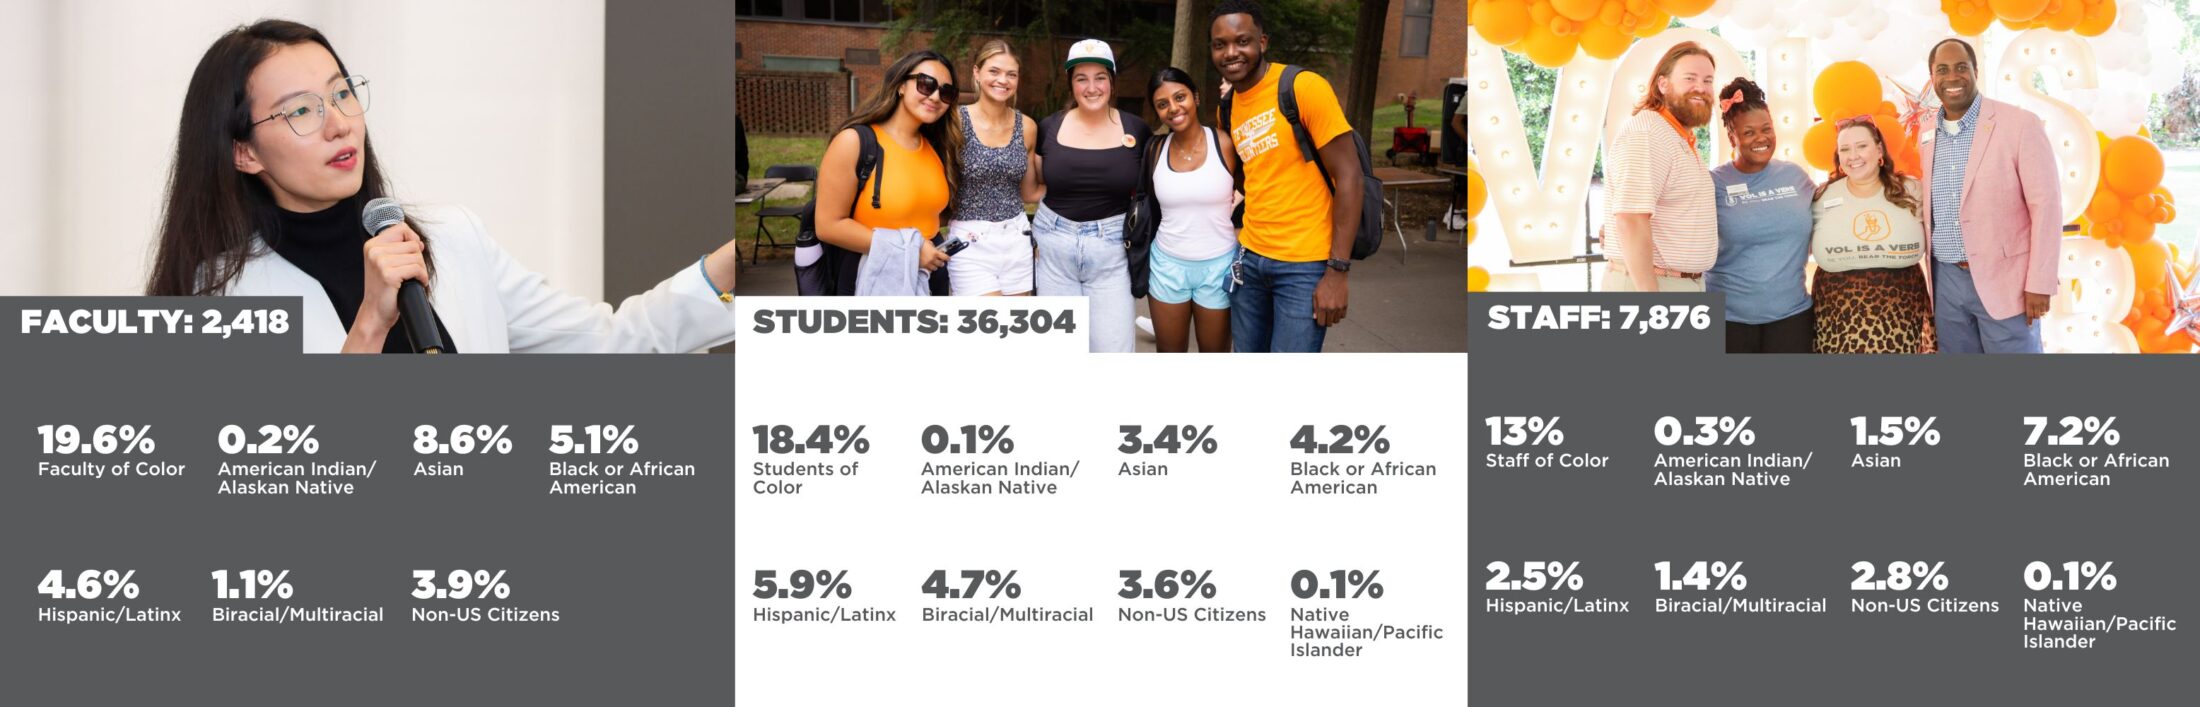
Breakdown of the Data1
According to our 2023/2024 data, there are 46,598 members of the Vol community (faculty, staff, and students). In total, our community contains 21,488 men (46.1%) and 25,110 women (53.9%).
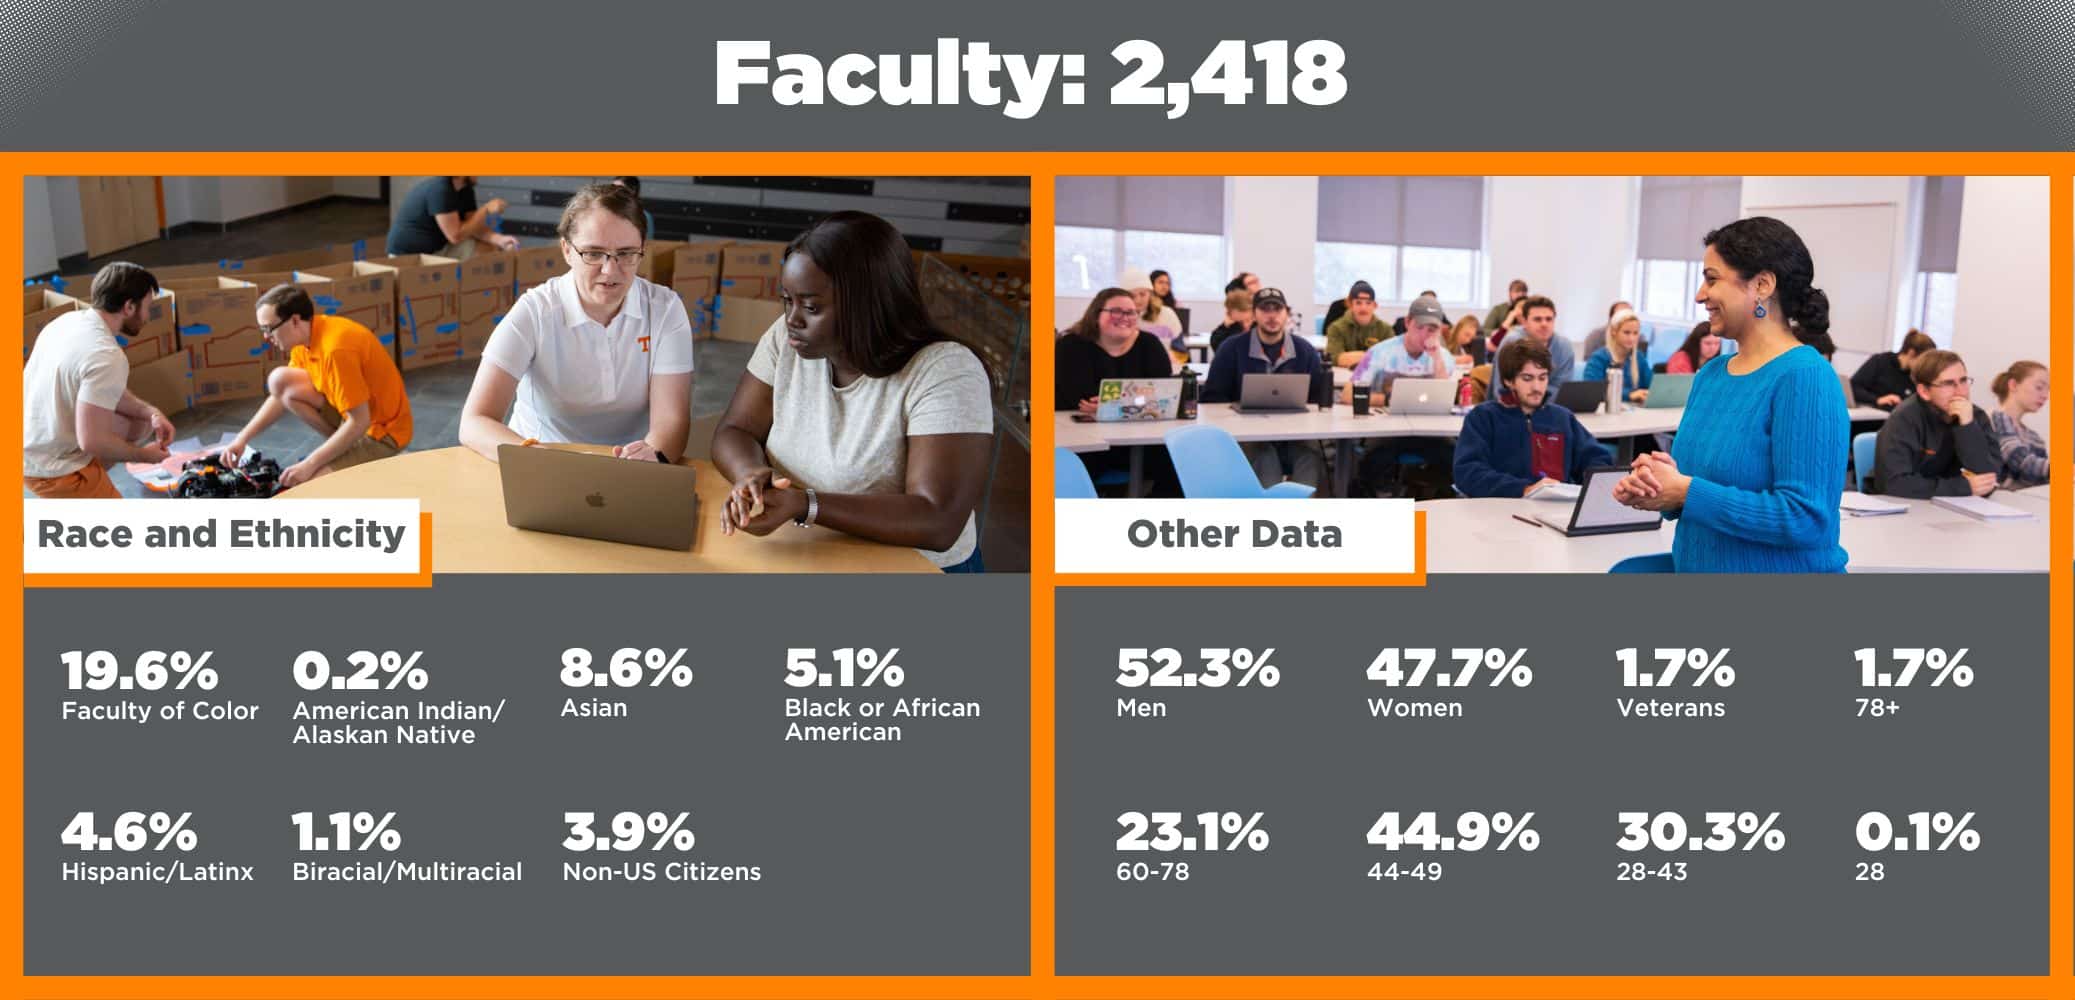
As of November 2023, the University of Tennessee has 2,418 faculty members, a 6.8% increase from 2022. Faculty of color make up about 19.6%. Female faculty also increased from 47.2% to 47.7%, while the number of male faculty dropped slightly from 52.8% to 52.3%. In terms of generational categories, most faculty are part of Generation X (44.9%), with Millennials being the second highest category (30.3%).
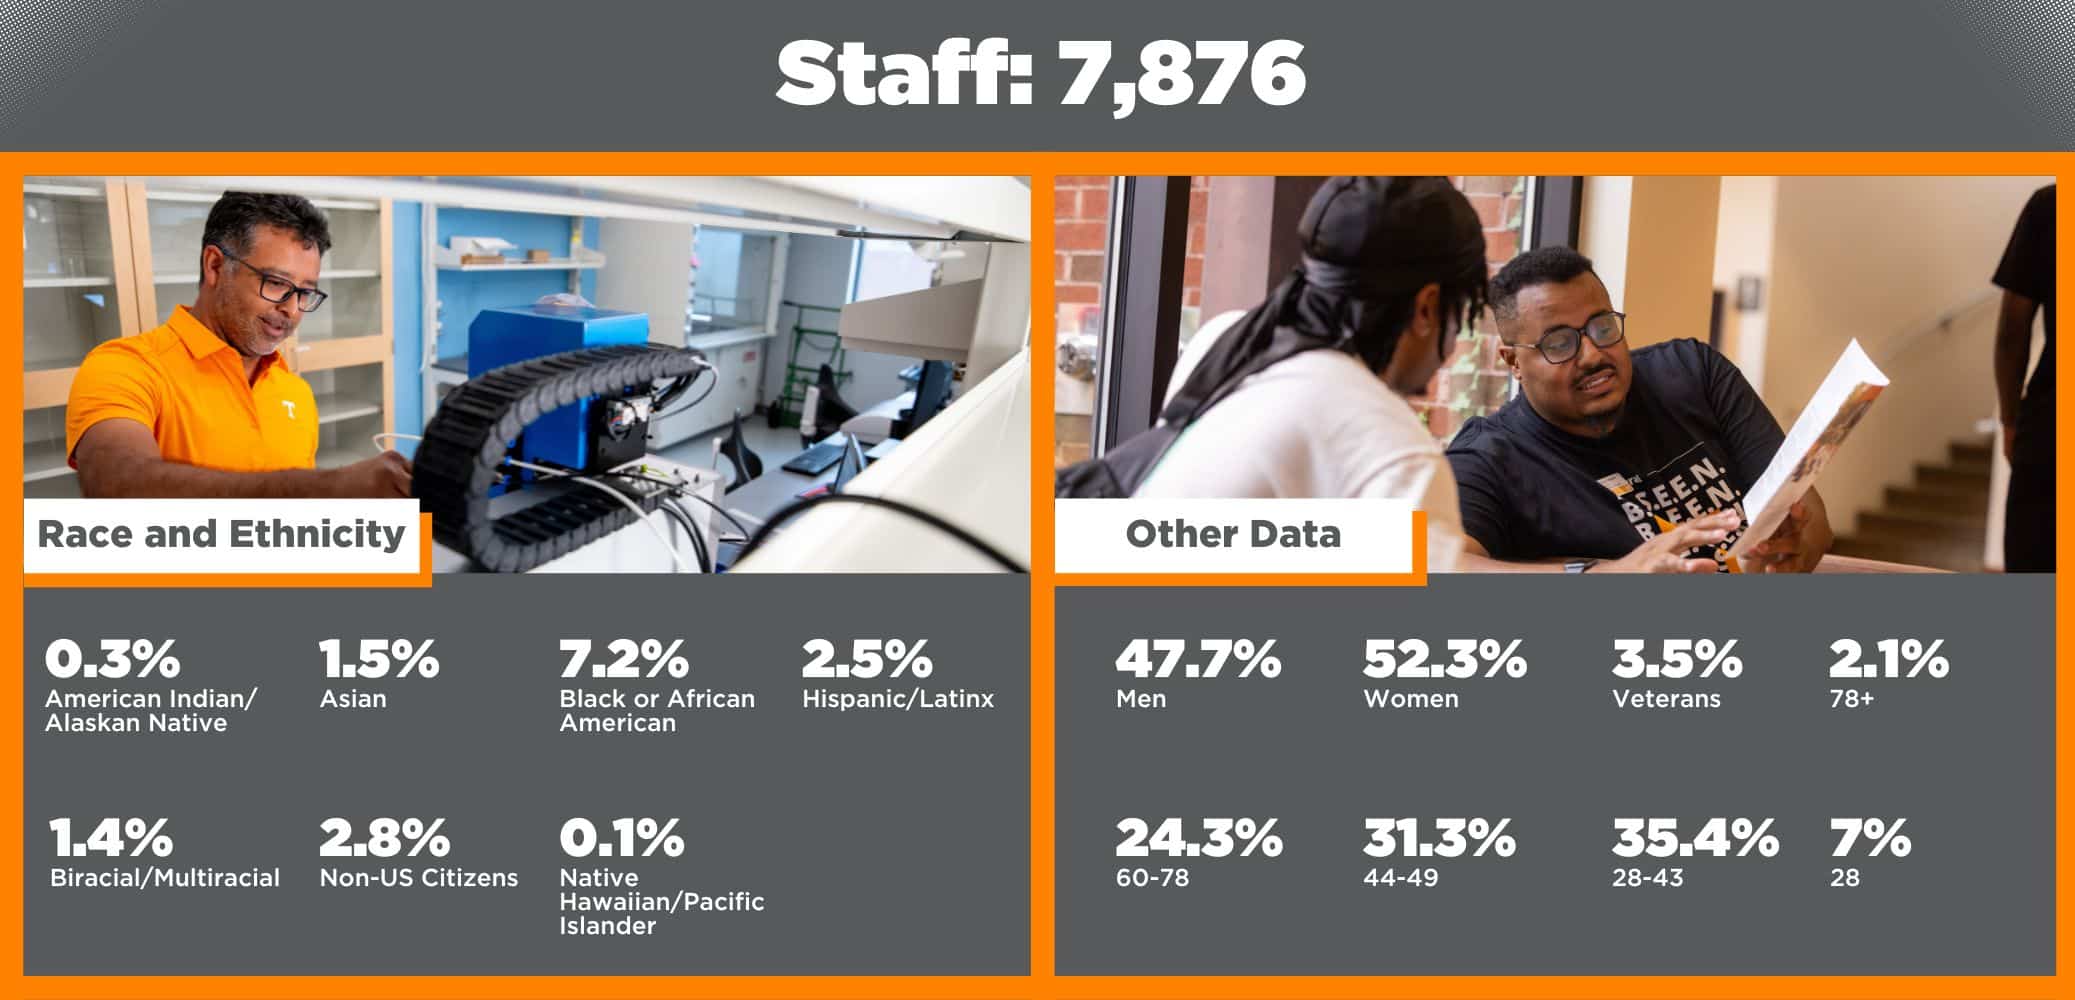
Our staff make up 16.9% of the Vol community. In the Fall of 2023, the University of Tennessee had 7,876 staff members. This number includes short-term and full-time staff. Of the ethnic populations represented below, the percentages of White and Hispanic employees showed the greatest increase between 2023 (6607 [83.9%] and 194 [2.5%] respectively) and 2022 (6,196 [84.8%] and 154 [2.1%] respectively). In terms of changes among different categories of employees, the most dramatic change was that in the number of African American staff in the Executive/Administration category, which increased from 31 employees in 2021 to 39 employees in 2023. There is little representation of employees of color in supervisory positions in the Secretarial/Clerical, Technical/Paraprofessional, Skilled Crafts, and Service Maintenance categories. Millennials make up the majority of university employees at 35.4%, followed by Generation X (31.3%) and Baby Boomers (24.3%).
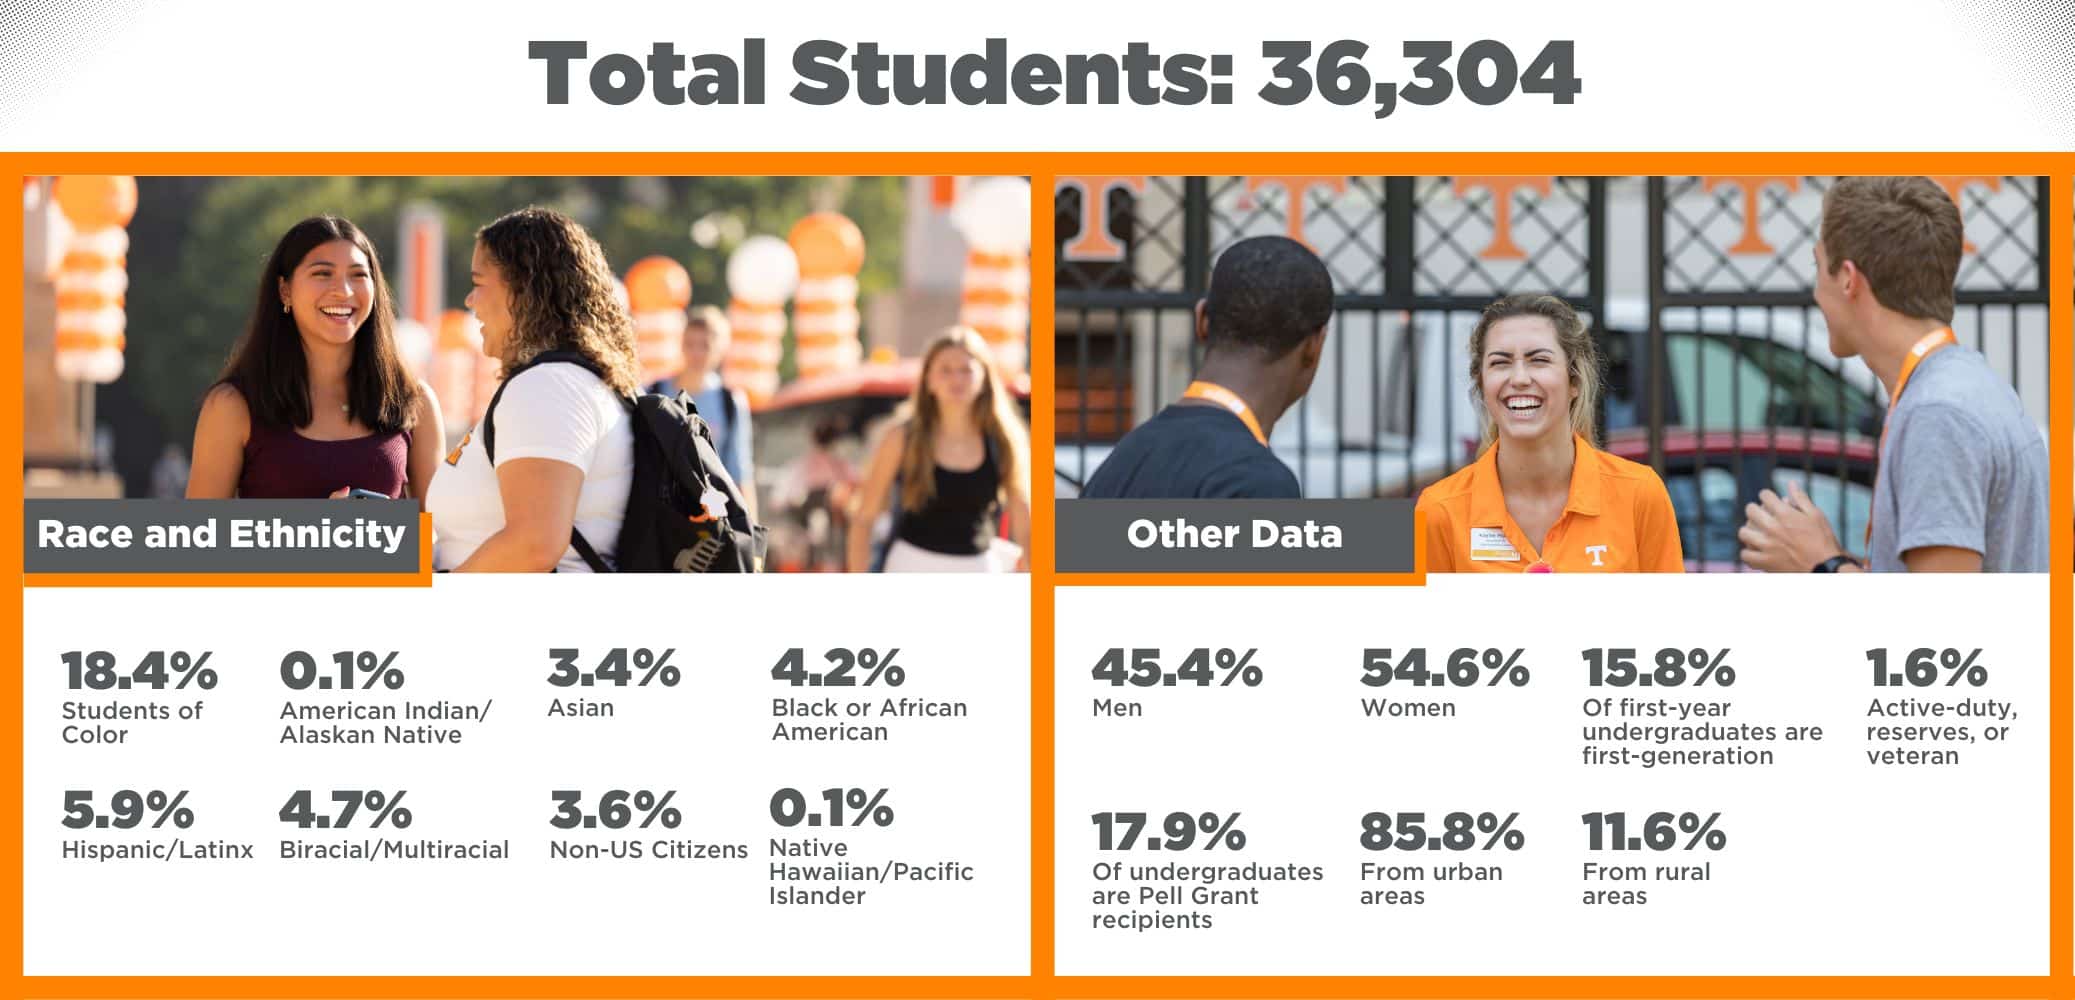
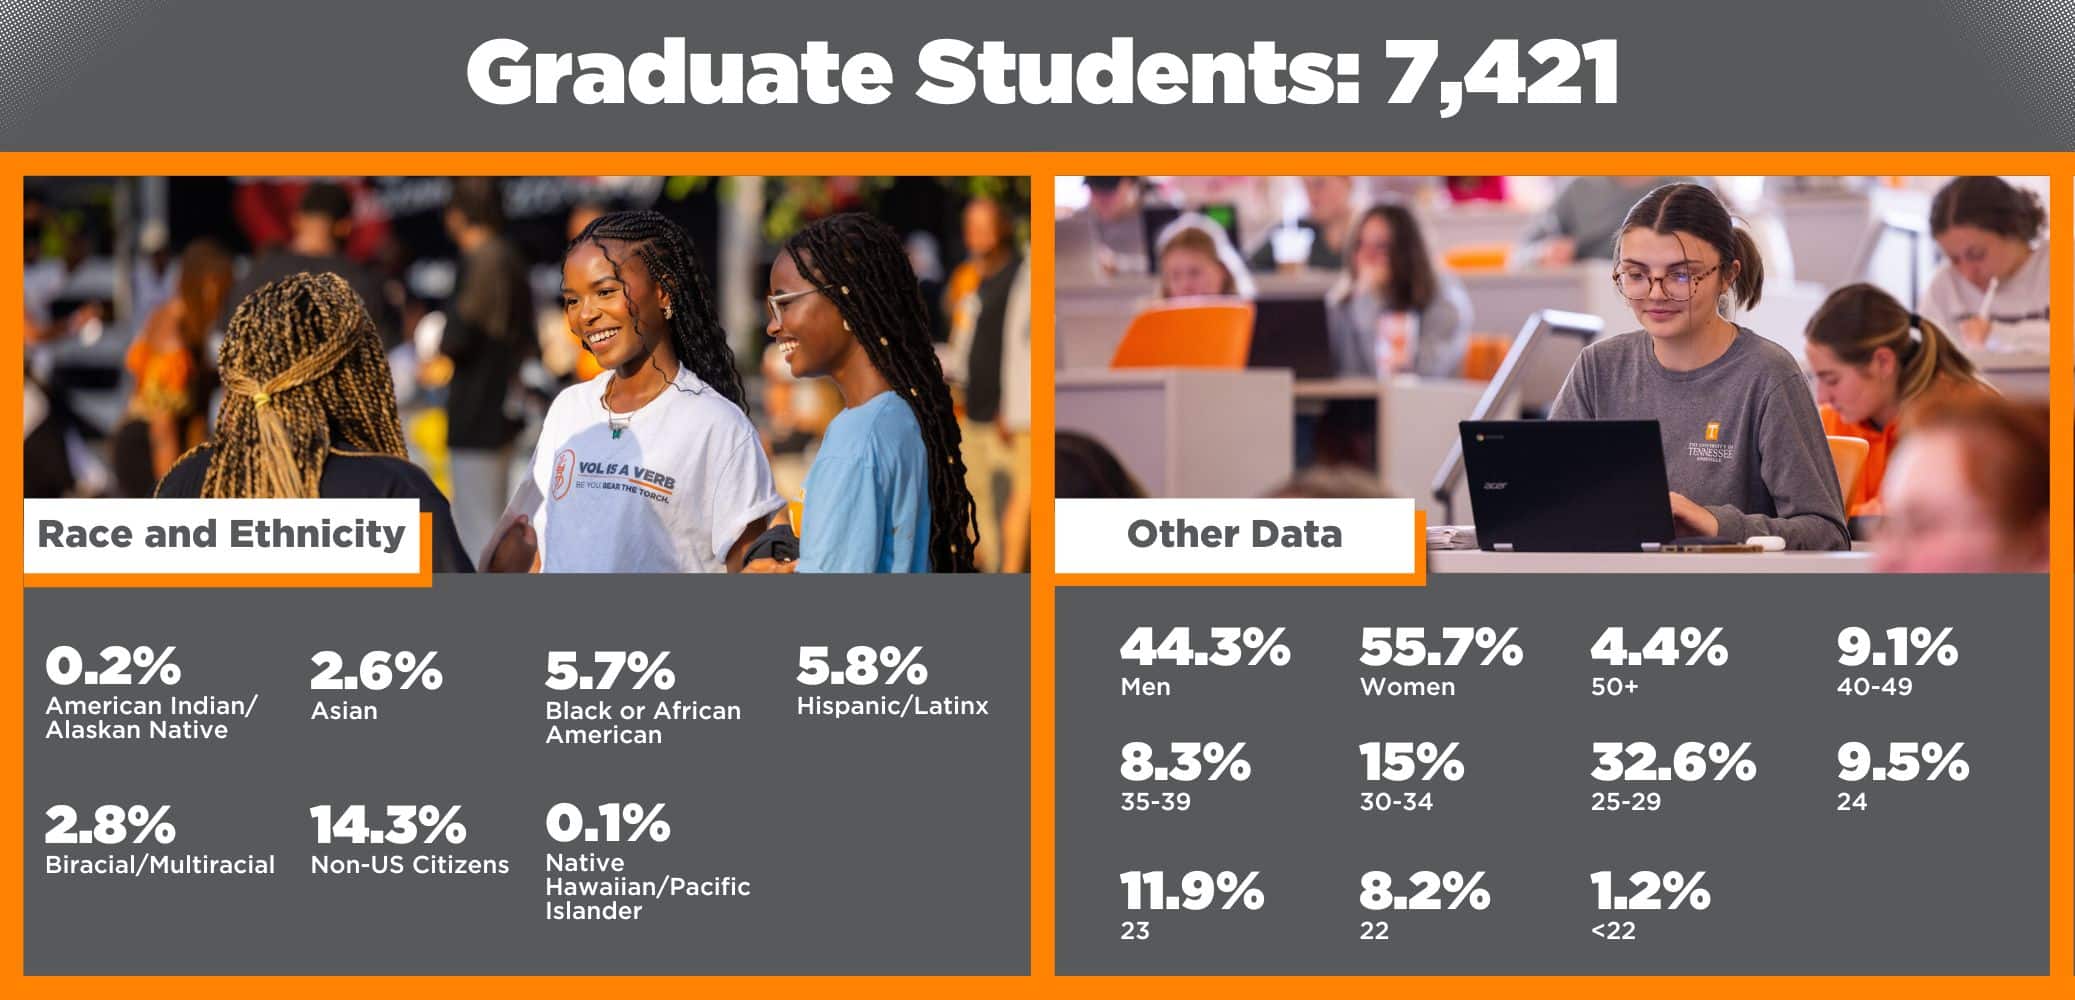
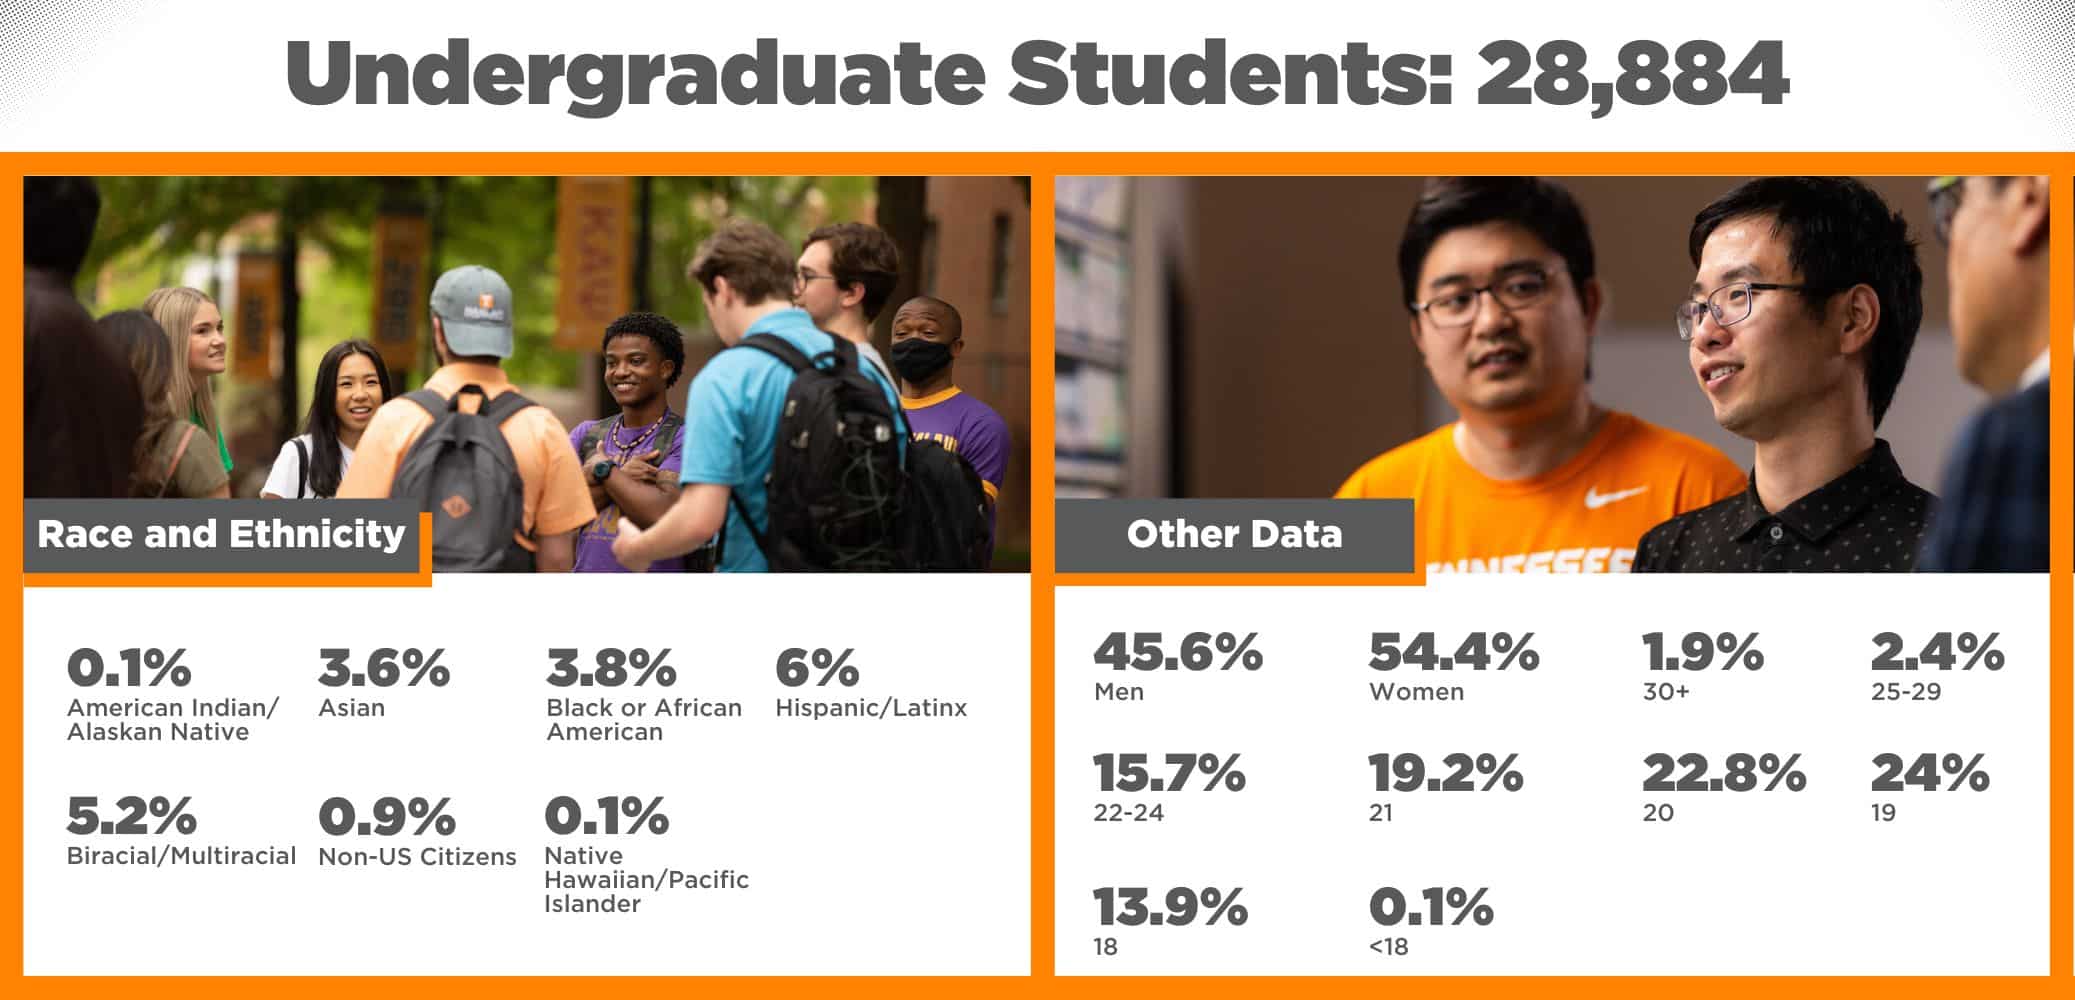
Our students make up 78% of the Vol community. During the Fall of 2023, the University of Tennessee enrolled 28,883 undergraduate students (79.6%) and 7,421 graduate students (20.4%). Both undergraduate and graduate student populations increased overall; however, of the ethnic populations represented below, the most substantial growth was in the Hispanic student population, which increased from 4.8% to 5.9% between 2020 and 2023. Additionally, the percentage of Multiracial students increased from 4.1% in 2021 to 4.7% in 2023. While most categories remained steady, the percentage of Black or African American students declined between 2020 and 2023 (5.5% to 4.2%, respectively). However, graduate student enrollment of Black and African Americans slightly increased from 366 students in 2022 to 426 students in 2023/2024.
The number of students who are women increased on our campus between 2020 and 2023 (53.2% to 54.6%). Students aged 20 and under make up much of the undergraduate student population (60.8%), while 56% of graduate and professional students are between the ages of 25 and 39. In terms of socioeconomic diversity, about 15.8% of undergraduate students are Pell Grant recipients, and approximately 16% of first-year undergraduate students self-reported as first-generation in 2023, compared to 18% in 2021 and 2022.
For a further breakdown of the data from this academic year, please see below.
Faculty by the Numbers2
Student Enrollment by the Numbers3
Staff by the Numbers4
Works Cited
U.S. Department of Health and Human Services. (2024, January 17). Race and national origin. National Institutes of Health. https://www.nih.gov/nih-style-guide/race-national-origin
Footnotes
1. GRA/GTA/GAs are not included in this number as they are already counted as graduate/professional students.
2. Faculty and Staff data is collected and reported as of early November of the selected year. The data includes all UTK, UTSI, and UTIA faculty and staff drawing a salary. This means that all tenure-line faculty, public service faculty, research faculty, instructors, lecturers, professors of practice, clinical professors, and teaching professors are counted in the data tables. Library faculty are also included in the faculty categories.
Additionally, some Executive/Admin positions are filled by tenured faculty. They are not counted in the faculty categories while serving in these roles. Emeritus faculty are included in instructional categories and are typically part-time. Term and temporary positions are also included in the final counts.
3. Student data is counted from the 14th day of class.
4. Staff numbers also include part-time and temporary staff. Graduate students serving in research, teaching, and other employment capacities are not included in staff numbers, but rather as part of the graduate/professional student data. This prevents graduate and professional students from being counted multiple times.